crosstalkr: R package for the identification of functionally important subnetworks
Crosstalkr provides a general implementation of a random-walk with restarts on graph structured data.
We also provide user-friendly implementations of the common use-case of using random-walk with restarts to identify subnetworks of biological protein-protein interaction databases.
Given a user-defined set of seed proteins, the main `compute_crosstalk` function will compute affinity scores for all other proteins in the network.
It will then compute a null distribution using a permutation test and compare the computed affinity scores to the null distribution to identify proteins with a statistically significant association to the user-defined seed-proteins.
Thanks to integration with stringdb, users can evaluate biological networks from 1540 different species
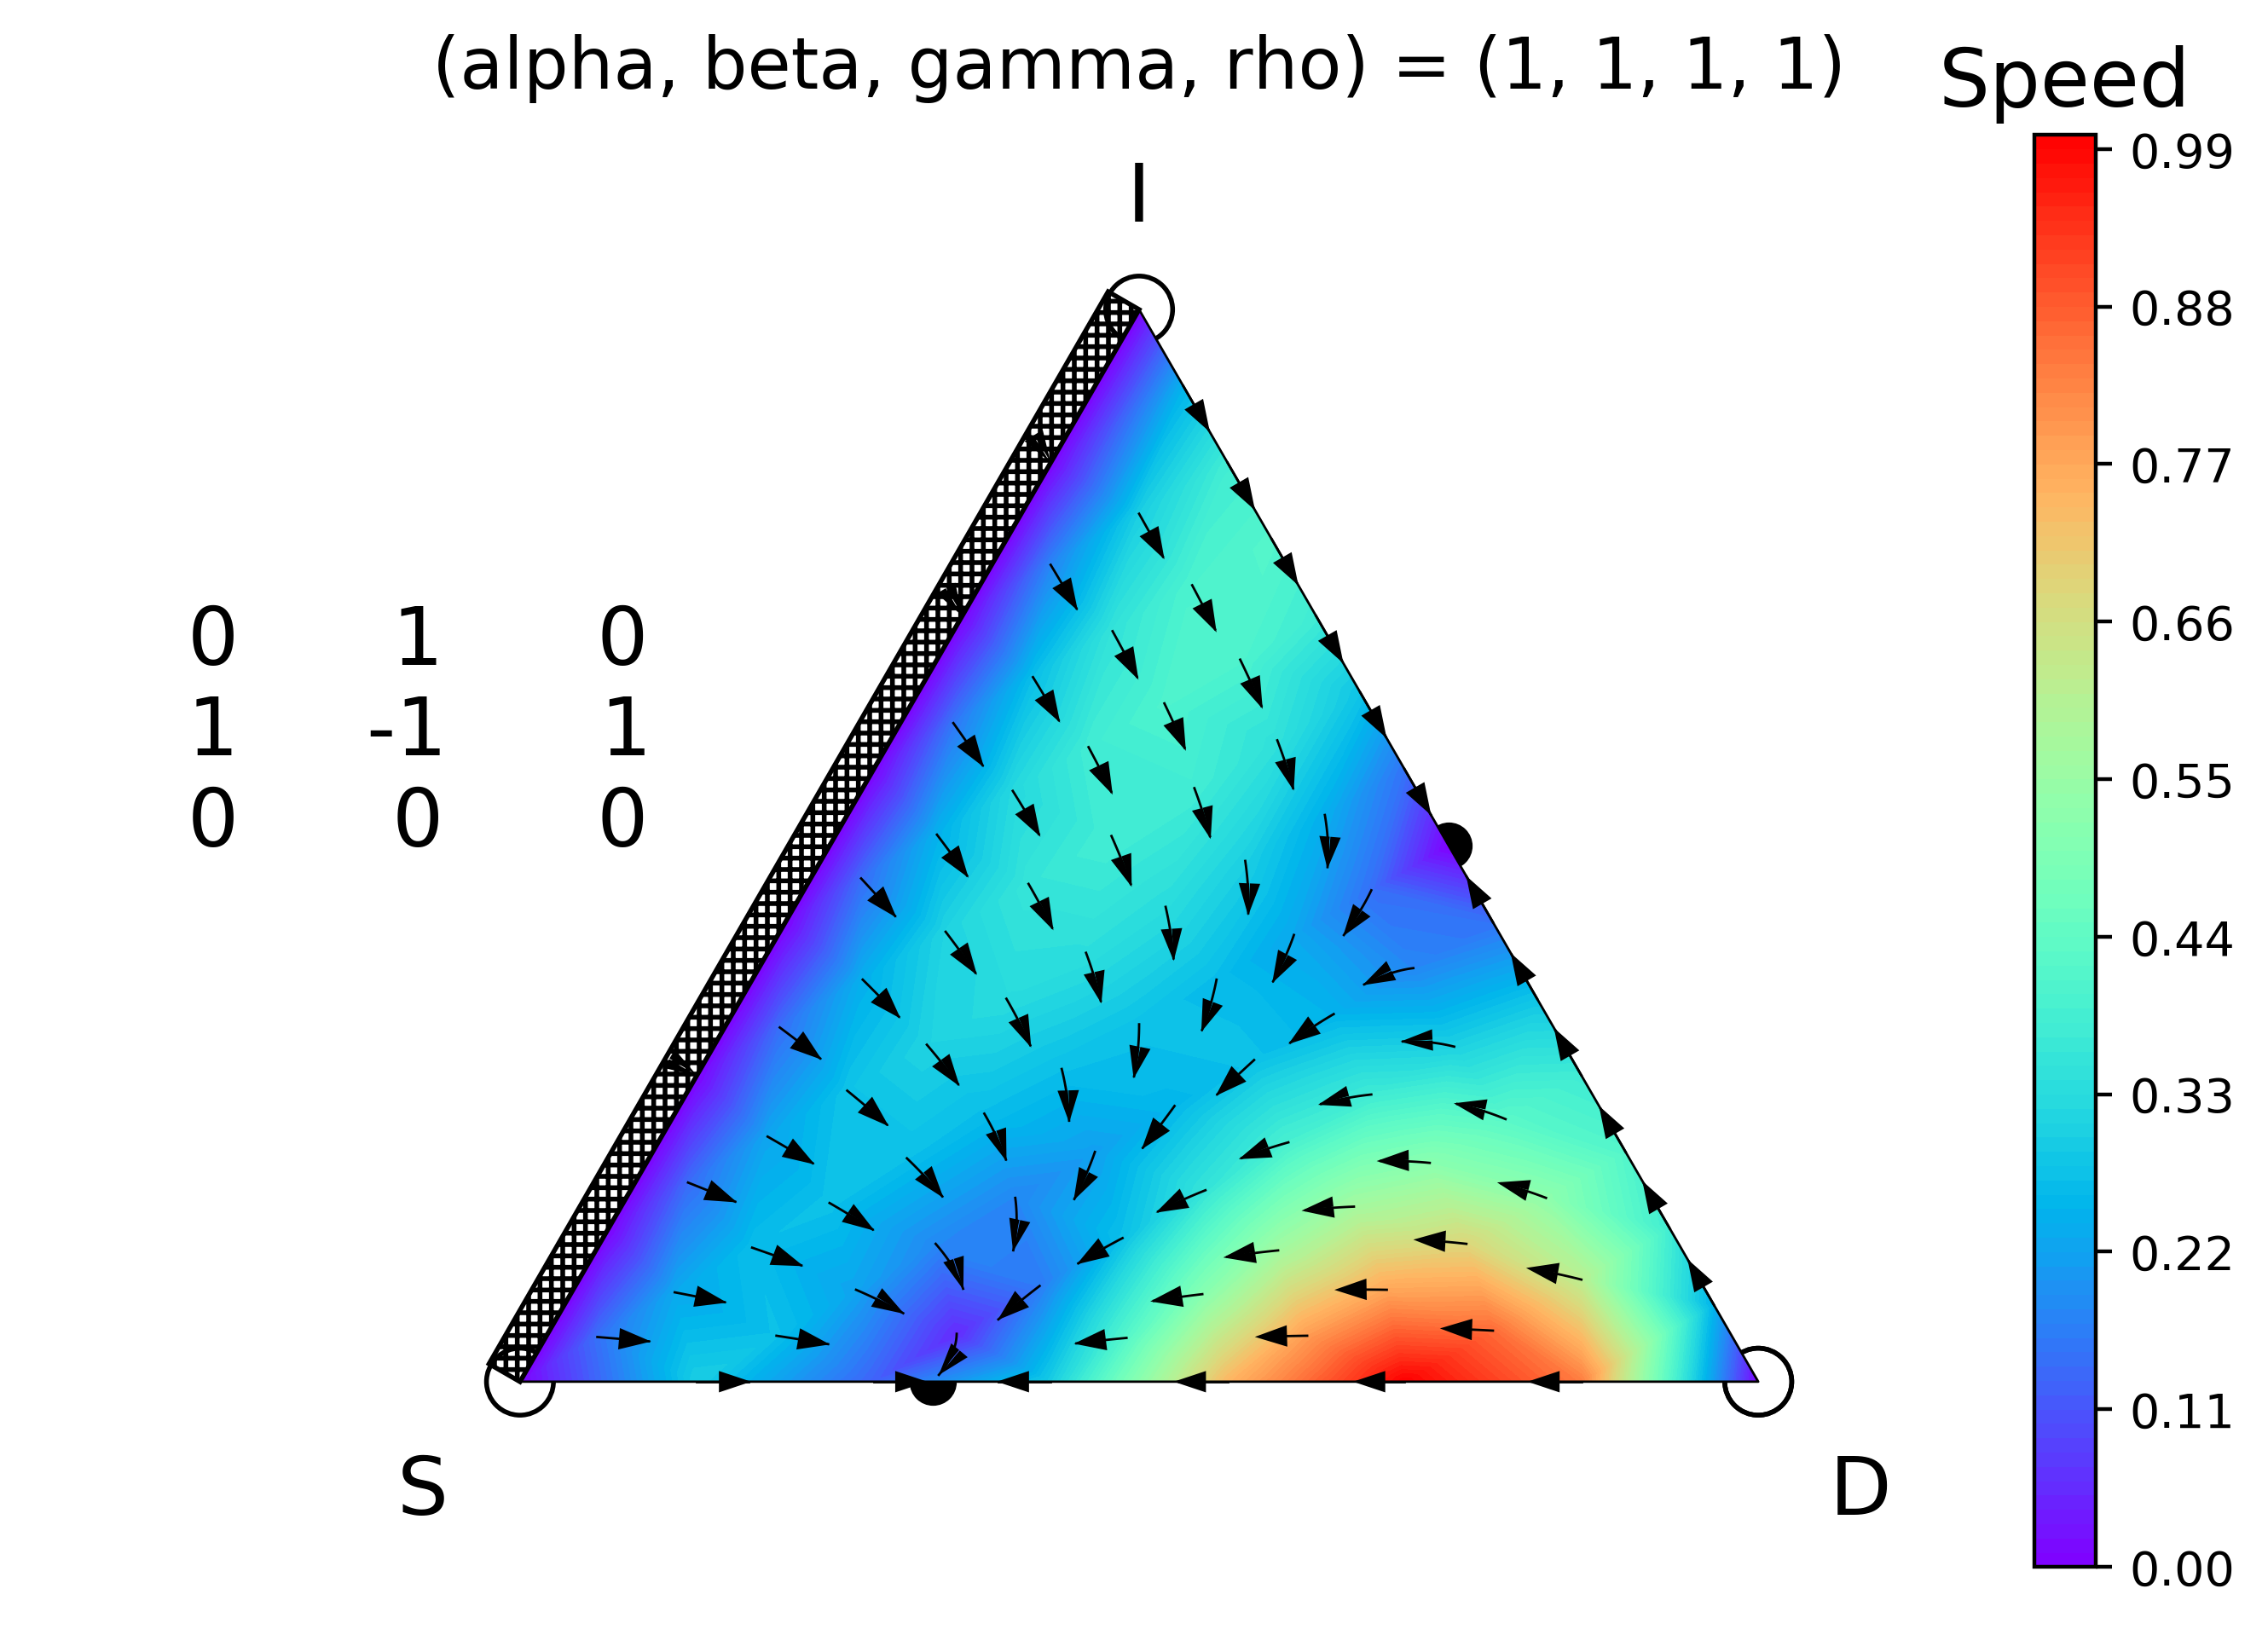
egtplot: A Python Package for 3-Strategy Evolutionary Games

Evolutionary game theory is a very broad modeling framework that effectively describes many aspects
of biological cooperation and competition.
Visualization of three-strategy evolutionary games has historically been difficult within the
Python ecosystem.
We have created a package to ease visualization efforts that is capable of displaying both static
and animated dynamics with the game space.
For detailed software usage instructions we refer readers to our interactive
jupyter
notebook.
More details are available in publication in
Journal of Open Source
Software where you can also find installation instructions.
ICON: Easy Access to Complex Systems Datasets in R
The ICON R package is named after the Index of Complex Networks (ICON) compiled by Prof. Aaron Clauset and the members of his lab.
ICON contains 1,075 complex network datasets in a standard edgelist format.
All provided datasets have associated citations that allow access to the raw data in its original format.
In addition to supplying a large and diverse corpus of useful real-world networks, ICON also implements an S3 generic to work with the network and ggnetwork R packages for network analysis and visualization, respectively.
We hope that ICON will serve as a standard corpus for complex network research and prevent redundant work that would be otherwise necessary by individual research groups.
For more details, you can read ICON's arXiv preprint, visit its CRAN
page, and review the associated GitHub repo. The repo contains all the
code powering the ICON R package and all the code used to convert raw data from the original format into a corresponding edgelist stored as an RDa/RData file.
See the README.md file for
information on how to get started.
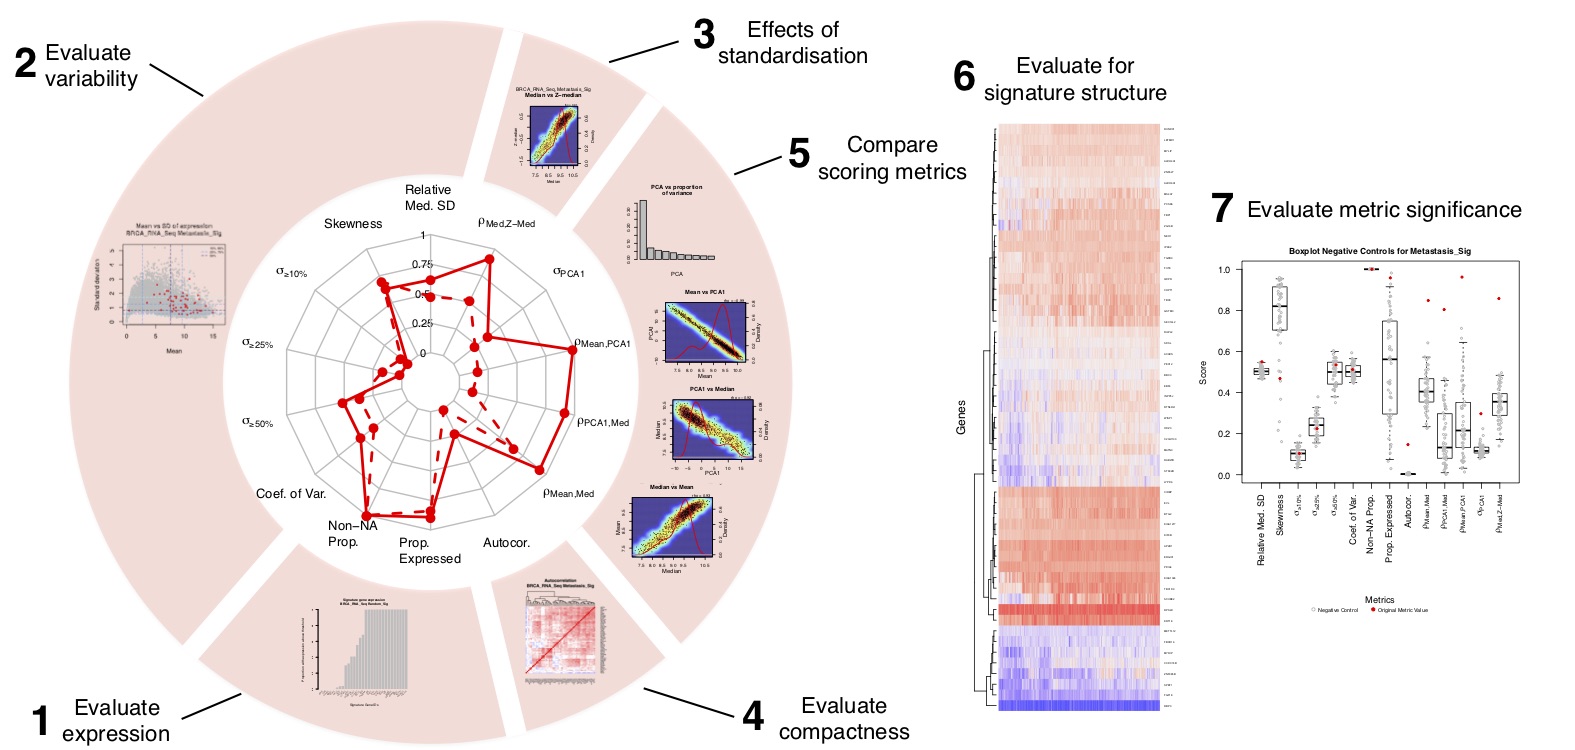
sigQC - A new standard for gene signature quality control
sigQC is an R package, available on CRAN, that we have worked in collaboration to develop,
defining an integrated methodology for gene signature quality control.
Increasing amounts of genomic data mean that gene expression signatures are becoming critically
important tools, poised to make a large impact on the diagnosis, management and prognosis for
a number of diseases.
For the purposes of this package, we define the term gene signature to mean: ‘a set of genes
whose co-ordinated mRNA expression pattern is representative of a biological pathway, process,
or phenotype, or clinical outcome.’
A key issue with gene signatures of this nature is whether the expression of many genes can be
summarised as a single score, or whether multiple components are represented.
In this package, we have automated the testing of a number of quality control metrics designed
to test whether a single score, such as the median or mean, is an appropriate summary for the
genes’ expression in a dataset.
The tools in this package enable the visualization of properties of a set of genes in a specific
dataset, such as expression profile, variability, correlation, and comparison of methods of
standardisation and scoring metrics.
Read more about it on Andrew’s
blog,
or in the Nature Protocols manuscript.
Try it for yourself today as well --
CRAN package.
TDAstats: R pipeline for computing persistent homology in topological data analysis


The TDAstats package is a comprehensive pipeline for conducting topological data analysis in R,
allowing useRs to calculate, visualize, and conduct statistical inference on persistent homology
in a Vietoris-Rips simplicial complex.
The increased use of next-generation sequencing (and other newer experimental methods) has
resulted in the increased prevalence of high-dimensional datasets.
Although dimension reduction methods (e.g. principal component analysis) have been used with
some success, it would be ideal to preserve all of the high-dimensional information within a
dataset during data analysis.
This is where topological data analysis and persistent homology come in.
Currently, the fastest method to compute persistent homology is the
Ripser C++ library, a variant of which is wrapped
by TDAstats using Rcpp.
This allows TDAstats to outpace other comprehensive pipelines for topological data analysis while
also being implemented in R, a language familiar to many data scientists.
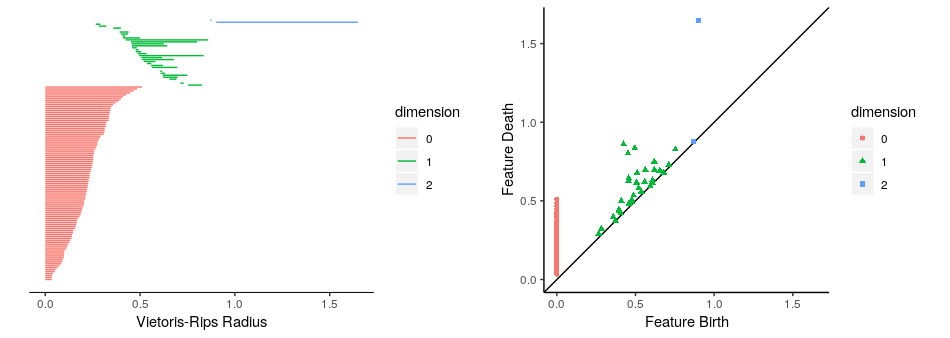
TDAstats allows visualization of persistent homology with either topological barcodes (below,
left panel) or persistence diagrams (below, right panel) as publication-quality figures using the
ggplot2 library, allowing useRs to fully
customize the plots.
Lastly, TDAstats is the first software library (as far as we know) that allows nonparametric
statistical inference on persistent homology using permutation tests.
This allows useRs to compare the topology, or "shape", of two datasets and determine if they originate
from similar populations.
Current efforts are being directed at applying TDAstats to elucidate knowledge about topological
graph theory.
TDAstats has been published in the
Journal of Open Source
Software.
For more details, you can visit its CRAN
page; the associated GitHub repo contains the
code behind TDAstats.
See the README.md file for
information on how to get started.
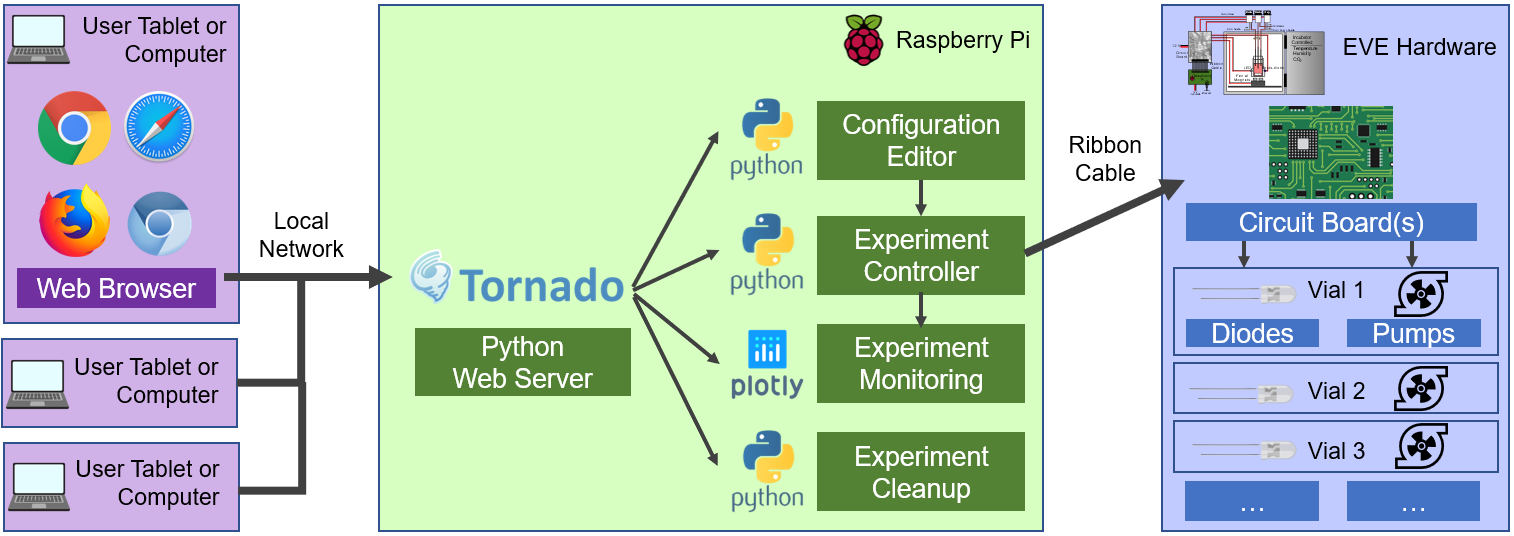
EVE: The EVolutionary biorEactor


The EVolutionary biorEactor is a tool to study the evolution of drug resistance in bacteria.
The paths that identical organisms take to achieve resistance to the same drug differs due to the inherent randomness of evolution.
By monitoring the phenotypes (and potentially also genotypes) of multiple cultures grown in similar conditions, we can get an idea of which evolutionary paths occur most frequently and target drugs consequently.
Software is written in Python and interfaces with circuit board through I2C. Innovative multi-threading is used to manage multiple culture units simulataneously.
A Tornado-based web server is used to configue, start, and monitor experiments.